
The Check Engine Light appeared yesterday while the vehicle was being driven. Today, the engine starts normally, the warning light may still be on, and nothing seems obviously wrong.
An OBD2 scanner retrieves a stored trouble code and a group of values recorded when the fault was detected. The scanner’s live-data screen, however, shows current values that appear normal.
Those results do not contradict each other. They represent two different points on the diagnostic timeline.
Understanding freeze frame vs live data begins with one question: are you examining what was stored when the problem occurred, or what the control module is reporting now?
Stage 1: What Happened Before the Fault?
The first part of the timeline is usually missing.
Generic freeze-frame information is not a continuous black-box recording of everything that happened before a fault. It does not normally include several minutes of sensor history leading up to the code.
To obtain a true pre-fault trend, a scan tool or logging device generally needs to be connected and recording live data before the problem occurs. Some manufacturer-specific systems may store additional event records, but those records are separate from the limited generic OBD2 freeze frame.
This distinction matters with intermittent problems. Freeze frame may reveal the operating conditions when a fault was recognized, but it cannot always show how the system gradually reached that condition.
Stage 2: Freeze Frame Captures the Fault-Related Moment
When the ECU detects a monitored malfunction and stores the relevant fault event, it may preserve a selected group of Parameter Identification values. That stored group is called freeze-frame data.
It is best understood as a photograph rather than a video.
The photograph may be associated with a pending or confirmed code depending on the vehicle, model year, and monitor strategy. It may also have been captured before the driver noticed the warning light. Therefore, “when the code was stored” and “when the driver saw the light” are not always the same moment.
What May Be Included in the Snapshot
Available information varies, but a generic freeze frame may contain:
- The DTC associated with the captured event
- Engine speed
- Vehicle speed
- Calculated engine load
- Engine coolant temperature
- Fuel-system status
- Short- and long-term fuel trims
- Throttle position
- Intake-air temperature
- MAF or MAP data
Not every vehicle supports every PID, and not every scanner displays all the data that may be available.
What the Snapshot Can Reveal
The greatest value of freeze frame is context.
Engine temperature may indicate whether the problem appeared during a cold start or after warm-up. Vehicle speed can show whether the car was stationary or moving. RPM and calculated load can help distinguish an idle event from a higher-load condition.
Fuel trims and fuel-system status may reveal how the computer was correcting the air-fuel mixture at that moment. Throttle, airflow, and manifold-pressure values can add more context when investigating a drivability or emissions-related code.
These values help narrow the conditions under which the fault occurred. They do not identify the failed part automatically.
What the Snapshot Cannot Prove
A single frame cannot show how quickly a value changed or whether the reading remained abnormal afterward. It may not capture a brief electrical interruption, and it does not include every possible sensor or module.
Freeze frame also cannot prove that the component named in a code definition has failed. A sensor-related code might be caused by wiring, a connector, power supply, an air leak, another system fault, or a reading that is accurate but outside the expected range.
The number of available frames can also differ. Some vehicles and tools expose one generic frame, while newer or manufacturer-specific systems may provide additional records. Another higher-priority event may affect which information remains available.
Why Freeze-Frame Data May Be Missing
A scanner may show a DTC without displaying a usable frame. Possible reasons include the code type, monitor strategy, model-year requirements, scanner limitations, or the data having been erased.
Clearing diagnostic codes commonly erases their associated generic freeze-frame information. That is why codes, status, and available frames should be recorded before anything is cleared.
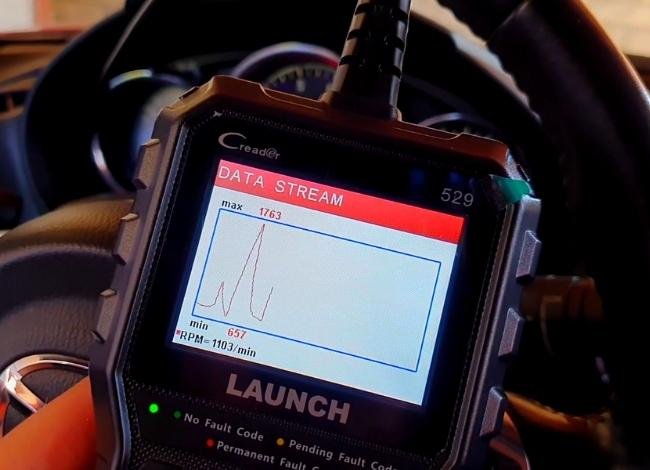
Disconnecting the scanner itself does not necessarily erase the data stored in the ECU, although a particular app may require a saved report to display it later.
A Stored Moment Is Only Half of the Story
Freeze frame answers, “What conditions were recorded when the fault event occurred?”
It does not answer, “What is the system reporting now?”
That second question is where freeze frame vs live data becomes especially useful. The stored snapshot preserves past context, while the next stage of the diagnostic timeline follows values that continue to change during the current scanner session.
Stage 3: Live Data Shows What the Vehicle Is Reporting Now
The live-data side of freeze frame vs live data begins when the scanner requests current information from a control module.
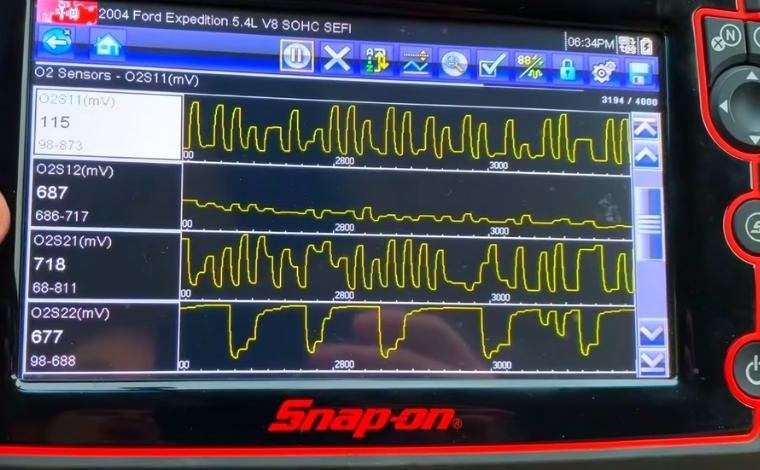
Instead of displaying one stored set of values, the scanner repeatedly updates supported Parameter Identifications. Those changing readings can show how the engine or another system is behaving during the present diagnostic session.
If the fault is active, live data may reveal the abnormal behavior. If the problem is intermittent and currently absent, the values may look normal even though a valid code and freeze frame remain stored.
What Counts as Live Data?
Live data can include sensor inputs, calculated values, controller commands, and system-status information.
For example, coolant temperature may represent a sensor-based input processed by the ECU. Calculated engine load is a value the ECU derives from several inputs. Commanded equivalence ratio describes what the controller is requesting rather than the direct output of one sensor.
This distinction prevents a common mistake: assuming every PID is a raw sensor measurement.
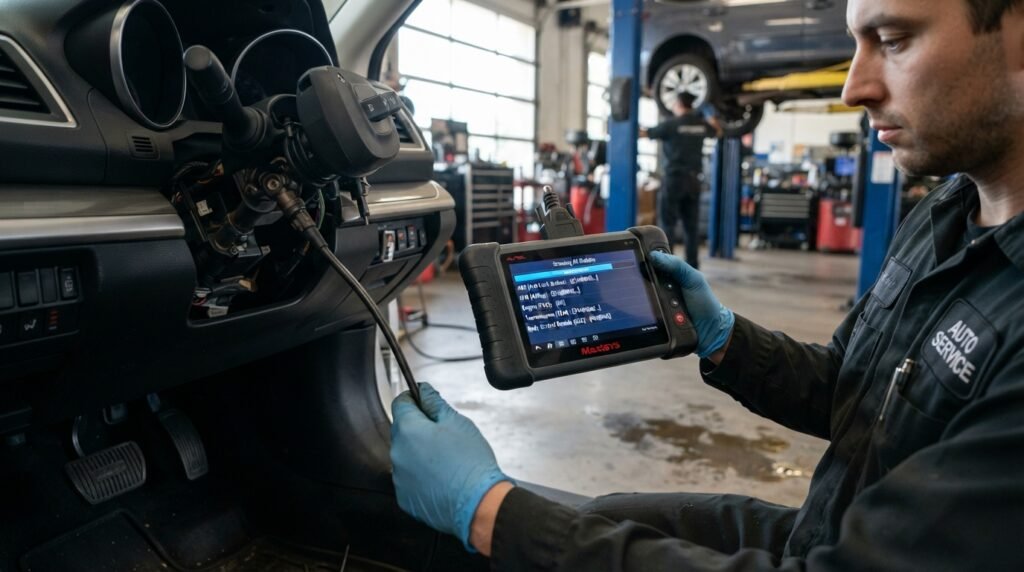
Depending on the vehicle and scanner, available live data may include engine speed, vehicle speed, fuel trims, airflow, manifold pressure, oxygen-sensor activity, throttle position, ignition timing, fuel-system status, and supported transmission or body-module parameters.
Generic OBD2 provides a standardized group of powertrain PIDs. Manufacturer-specific live data may require enhanced software and exact vehicle coverage.
A Current Value Is More Useful When It Can Be Compared
One isolated reading rarely provides enough evidence.
Live data becomes more useful when related PIDs are viewed together. A technician might compare commanded and reported values, examine whether two related sensors agree, or graph a parameter to see whether it changes smoothly.
Recording can preserve that changing stream for later review. However, a scanner-created live-data recording is not the same as an ECU-generated freeze frame. The recording exists because the tool was connected and logging at that time.
Why “Live” Does Not Mean Instantaneous
An OBD2 scanner does not display every internal ECU calculation at the exact instant it occurs. It requests or receives data, processes the response, and updates the screen.
Refresh speed depends on several factors:
- The vehicle’s communication protocol
- ECU response speed
- Scanner hardware and software
- Wireless connection performance
- The number of selected PIDs
- The modules or networks being monitored
Displaying a long list of parameters can slow updates because the scanner must collect more information during each cycle. Selecting a smaller group of relevant PIDs can improve refresh speed and make relationships easier to interpret.
Even a fast scan tool is not equivalent to a laboratory oscilloscope. A very brief electrical interruption may occur between data samples and never appear clearly on the live-data screen.
Snapshot vs Stream
| Diagnostic Question | Freeze Frame | Live Data |
|---|---|---|
| When was the information captured? | During a stored fault-related event | During the current scanner session |
| Does it remain after the symptom disappears? | Often, until the related data is erased | Only if the scanner records and saves it |
| Does it show a trend? | Usually no; it is a limited snapshot | Yes, when values are watched, graphed, or recorded |
| Does it require the problem to be active now? | No, if the stored frame remains available | Usually most useful when the condition is active |
| Are all PIDs included? | No; only the stored set | No; only supported and selected parameters |
| Can clearing codes affect it? | Yes; associated data may be erased | The current stream continues, but ECU resets may change learned values |
| What is its strongest use? | Reconstructing fault-set conditions | Observing current behavior and relationships |
Why Normal Live Data Does Not Cancel a Stored Fault
Suppose an intermittent problem occurred only after the engine warmed up, during a particular load, or when an electrical connection briefly failed. If that condition is not present during the current scan, live readings may remain within their expected ranges.
That does not make the code false. The freeze frame documents what the ECU captured during the event, while live data describes a different moment.
The reverse is also possible. Live data may reveal an abnormal value before a monitor has completed the conditions needed to store a DTC and freeze frame.
The practical difference in freeze frame vs live data is therefore time and continuity. One preserves limited past context; the other follows supported values as they change now. The strongest diagnosis comes from comparing the two instead of treating either one as complete evidence.
Put the Snapshot and Stream on the Same Timeline
The real diagnostic value of freeze frame vs live data appears when the two are compared rather than interpreted separately.
Freeze frame identifies the conditions associated with a stored fault event. Live data then shows whether the same parameters remain abnormal, have returned to normal, or change under comparable operating conditions.
The goal is not to force the vehicle to recreate a dangerous symptom. It is to use the stored conditions as a guide for safe, controlled testing.
Worked Example: P0171 Is Stored, but the Engine Runs Normally
Suppose a scanner retrieves P0171, indicating that Bank 1 reached a system-too-lean threshold.
The freeze frame shows that the engine was fully warm, vehicle speed was zero, RPM was near normal idle, and both short- and long-term fuel trims were strongly positive. Those values suggest that the ECU was adding fuel when the fault was stored.
During the present scan, the engine may be cold and the trims may appear much closer to normal. That does not disprove the stored lean condition because the vehicle is no longer operating under the same circumstances.
A technician can use the freeze frame to identify the relevant conditions, then compare a small group of live PIDs during safe, controlled operation. If positive fuel correction becomes much stronger at warm idle than under other conditions, an intake-air or vacuum-related problem may deserve investigation. If correction remains high across multiple conditions, airflow measurement or fuel delivery may require more attention.
Neither pattern confirms a failed component. Smoke testing, pressure testing, wiring checks, and vehicle-specific procedures may still be required.
A Five-Step Diagnostic Workflow
A sensible freeze frame vs live data workflow preserves the historical evidence before examining the present behavior.
Step 1: Read Every Relevant Code
Record the exact DTC, its status, and the module that stored it. Related codes may change how the data should be interpreted.
Step 2: Save the Freeze Frame Before Clearing Anything
Capture the available RPM, temperature, speed, load, fuel trims, and other useful PIDs. Clearing codes may permanently remove this context.
Step 3: Identify the Operating Condition
Determine whether the stored event happened during cold start, warm idle, cruising, acceleration, or another recognizable condition. Do not assume the driver noticed the warning at that same instant.
Step 4: Select a Small Live-Data Group
Choose only the PIDs related to the code and suspected system. A shorter list is easier to interpret and may refresh faster than a complete data set.
Step 5: Compare Safely and Confirm With Testing
Use stationary checks where possible. If moving-vehicle data is necessary, the driver should never watch or operate the scanner. Use automatic logging, a passenger, or a qualified technician, and do not intentionally reproduce severe hesitation, stalling, overheating, or another unsafe condition.
Common Mistakes That Distort the Evidence
Clearing the Code First
This may erase the most useful clue about when and how the fault occurred.
Treating Freeze Frame as a Current Reading
The stored values belong to a past event. They do not describe the vehicle’s present condition.
Assuming Normal Live Data Makes the Code False
An intermittent problem can disappear before the scanner is connected.
Watching Too Many PIDs
A crowded display is harder to interpret and may reduce refresh speed.
Trusting One Abnormal Value
A value may be affected by operating conditions, another failed system, calculation strategy, incorrect units, or unsupported data.
Using Universal “Normal” Numbers
Expected readings can change with engine design, temperature, altitude, load, and control strategy. Vehicle-specific information provides better context.
Which One Should You Check First?
Check the stored code and freeze frame first because that information may be lost if memory is cleared. Then examine live data to understand what the system reports now.
Freeze frame is especially valuable when the warning appeared earlier and the vehicle currently behaves normally. Live data is more useful when the condition is active, related PIDs need to be compared, or a changing trend must be graphed or recorded.
Neither one is automatically better. They answer different diagnostic questions.
Frequently Asked Questions
Q1: Does Every DTC Store Freeze-Frame Data?
A1: No. Availability depends on the fault, monitor strategy, vehicle, model year, and scanner access. Some codes may have no visible generic frame.
Q2: Is Freeze Frame the Same as Recorded Live Data?
A2: No. Freeze frame is stored by the vehicle in connection with a fault event. Recorded live data is created by the scan tool while it is connected and logging.
Q3: Does Clearing Codes Delete Freeze Frame?
A3: Clearing emissions-related DTCs commonly erases their associated generic freeze-frame data. Save the information before using the erase function.
Q4: Can Live Data Prove a Sensor Is Bad?
A4: Usually not by itself. It can reveal an implausible or inconsistent value, but wiring, reference voltage, grounds, related systems, and operating conditions still need consideration.
Q5: Why Does Live Data Update Slowly?
A5: The refresh rate depends on the vehicle protocol, ECU, scanner, connection, and number of displayed PIDs. Selecting fewer relevant parameters often improves the update rate.
Q6: Is It Safe to Watch Live Data While Driving?
A6: The driver should never look at or operate a scanner while the vehicle is moving. Use scanner logging, a passenger, or a professional technician. If the vehicle is stalling, overheating, losing power severely, or behaving unpredictably, avoid testing it on the road.
Final Thoughts
The clearest way to understand freeze frame vs live data is to place them on one timeline. Freeze frame preserves selected conditions from a stored fault event, while live data displays supported values during the present scan.
Save the snapshot first, use the stream to examine current behavior, and confirm the pattern before replacing parts. Together, they reduce guesswork—but neither replaces proper testing.