
Last Updated on June 3, 2025
If you are a car owner, chances are you’ve encountered a few engine lights or error codes on your dashboard. Have you ever tried diagnosing those issues on your own? Do error codes feel confusing or overwhelming? If yes, then this guide is tailored just for you. Today, we’ll walk you through how to read live data from OBD II scanners, understand what the data means, and how to use it to make better vehicle maintenance decisions.
Modern vehicles are filled with complex electronics and sensors, all managed through an onboard diagnostic system known as OBD2. When something goes wrong, the system generates Diagnostic Trouble Codes (DTCs) and produces live data that represents the real-time health of your car. This article explains how live data works, the types of information you can retrieve, and how to interpret the results.
Want to explore more scanner tools? Check out our detailed reviews of the best OBD2 scanners with live data.
What is Live Data in OBD2?
Live data is a continuous stream of sensor data pulled directly from your vehicle’s Engine Control Unit (ECU). It shows how your vehicle is performing in real time. This data can include:
- Engine RPM
- Throttle position
- Fuel trims
- Oxygen sensor voltages
- Coolant temperature
- Intake air temperature
- Mass airflow
- And much more
The purpose of live data is to give you or your mechanic a snapshot of how different systems in your car are behaving at any given moment. By comparing this live data against factory specifications, you can identify faults that may not trigger a DTC.
How Does OBD2 Technology Work?
The OBD2 system is a built-in, self-monitoring diagnostic tool present in all vehicles manufactured after 1996. It communicates with sensors throughout your car to detect issues and alert the driver via dashboard lights.
Here’s how it works:
- A 16-pin OBD2 port is located under the dashboard, usually near the steering wheel.
- You plug in an OBD2 scanner, which reads data from the vehicle’s ECU.
- The scanner displays both static codes and live sensor data.
- Advanced scanners can interpret this data and even offer suggestions.
If you’re new to OBD2 scanners, our beginner’s guide to using OBD2 tools can help you get started.
What Types of Live Data Can You Read?
Live data varies based on the type of vehicle and the scanner used. High-end scanners provide more comprehensive data. Some of the most common live data readings include: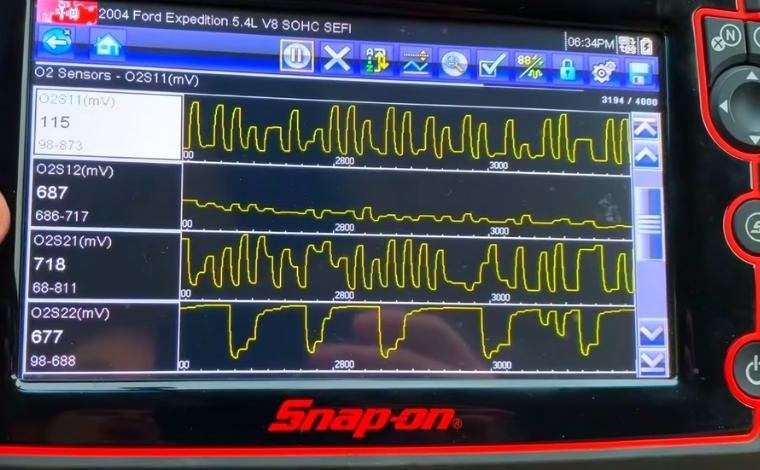
1. Engine RPM
RPM (Revolutions Per Minute) indicates how fast the engine’s internal components are operating. If the RPM is too high or too low, it could suggest problems like misfires or idle control issues.
2. Oxygen Sensor Voltage
The oxygen sensor checks the air-fuel mix. Ideal voltage readings should fluctuate around 0.1 to 0.9 volts. Consistent high or low values may point to sensor failure or exhaust leaks.
3. Intake Air Temperature (IAT)
This sensor monitors the temperature of air entering the engine. Abnormal readings can disrupt combustion and reduce engine efficiency.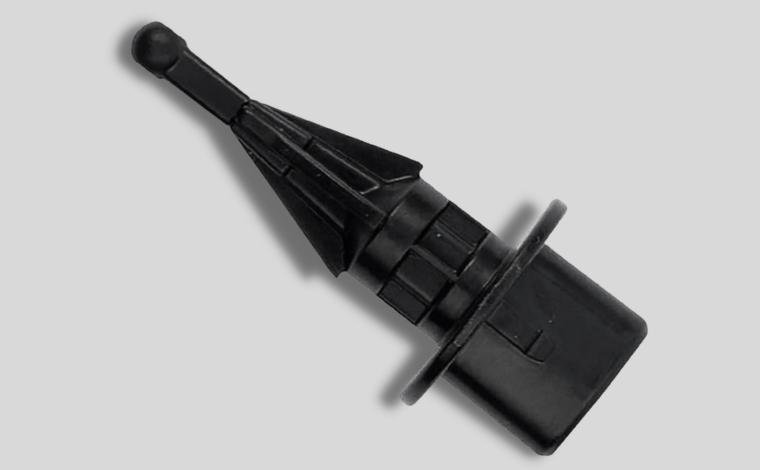
4. Engine Coolant Temperature
Ideal readings typically range from 200°F to 220°F. A higher or lower reading may cause poor fuel economy and performance issues.
5. Fuel Trims
Fuel trims indicate how the ECU adjusts fuel delivery based on sensor input.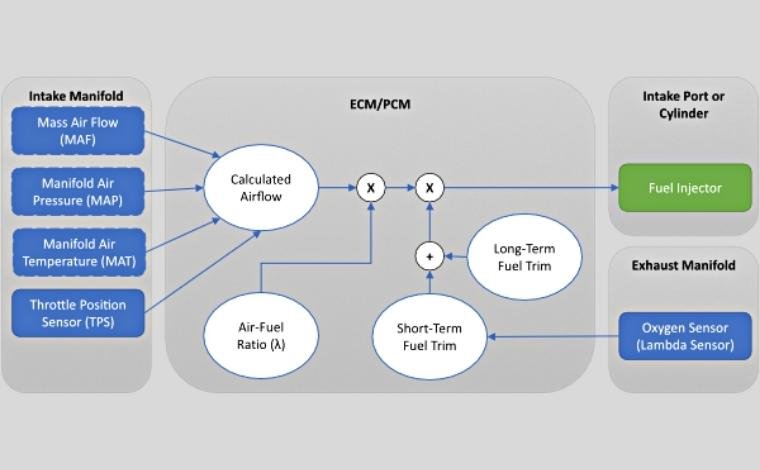
- Short-Term Fuel Trim (STFT): Adjusts fuel instantly
- Long-Term Fuel Trim (LTFT): Averages the STFT over time
Ideal STFT values: -10% to +10%
Ideal LTFT values: -5% to +5%
6. Mass Air Flow (MAF)
This sensor calculates the air mass entering the engine. Irregular readings can indicate vacuum leaks or sensor issues.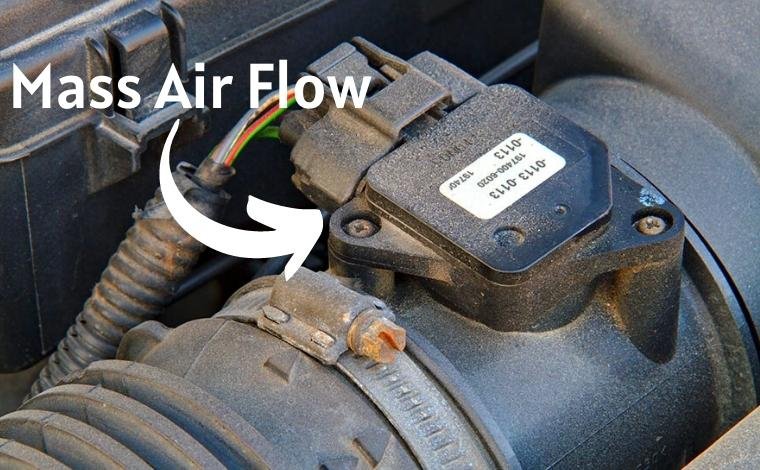
7. Manifold Absolute Pressure (MAP)
Used to determine engine load, fuel metering, and spark timing. Inaccurate MAP readings can cause rough idling and performance issues.
Need a scanner that reads these parameters? Explore our recommended live data scan tools.
Why Is Live Data Important?
Understanding how to read live data from OBD II scanners is essential for preventative maintenance. Here’s why it matters:
Real-Time Diagnosis
Live data allows immediate insight into engine conditions, emissions, fuel efficiency, and more—before issues become expensive repairs.
Fault Location
Instead of guessing, live data pinpoints exact problem areas like:
- Faulty spark plugs
- Weak O2 sensors
- Clogged fuel injectors
Code Verification
Sometimes, trouble codes are triggered by temporary issues. Live data helps confirm whether a repair is truly needed.
Check Engine Light Resolution
Live data is invaluable for clearing codes. If everything looks good and the light remains on, it’s likely a sensor issue—not a major fault.
Enhanced DIY Capabilities
Live data empowers car owners to take control of their vehicle maintenance. You can confidently perform basic repairs and avoid unnecessary mechanic visits.
Emission Compliance
Live data helps ensure your vehicle passes state emissions tests by tracking data like oxygen sensor efficiency and catalytic converter performance.
For deeper insights on emission readiness, read our article on common causes of failed emissions tests.
How to Interpret OBD2 Live Data Accurately
Once your scanner is connected and you’re seeing live data, interpretation is the next step. Here’s how:
Step 1: Record Baseline Readings
Before making assumptions, compare current values with manufacturer specifications. Use your vehicle’s repair manual for reference.
Step 2: Check for Extremes
High or low extremes in fuel trims, temperatures, or voltages are red flags. For example:
- O2 Sensor Voltage stuck at 0.9V: Too rich fuel mix
- Coolant temp stuck below 160°F: Thermostat issue
Step 3: Analyze Patterns
Instead of single numbers, observe how values fluctuate:
- Does STFT bounce too much?
- Is the MAF reading consistent with engine RPM?
- Does the MAP reading change with throttle input?
Step 4: Use Diagnostic Apps
Many Bluetooth-enabled scanners can sync with mobile apps like:
- Torque Pro
- OBD Auto Doctor
- Car Scanner ELM OBD2
- OBDeleven
These apps often provide graphical charts and comparisons that make interpretation easier.
Looking for apps? Read our breakdown of top OBD2 mobile apps.
Step 5: Don’t Rely Solely on Codes
Always cross-check live data. A P0171 code (system too lean) might not need a fuel injector replacement if live data shows a faulty MAF sensor instead.
Tips to Get Accurate Live Data + Conclusion
Even the best OBD2 scanner may show incorrect data if certain conditions aren’t met. To ensure accuracy:
Tip 1: Verify Vehicle Compatibility
Some OBD2 scanners are vehicle-specific. Always use a universal or compatible scanner like Innova 3140 for broader support.
Tip 2: Ensure Proper Connection
Securely plug the scanner into the 16-pin port. Use quality cables if it’s a wired scanner, or pair Bluetooth devices correctly.
Tip 3: Maintain Optimum Engine Temperature
Scan when the engine is warm (around 180°F) to avoid skewed cold-start data.
Tip 4: Use Premium Diagnostic Apps
Free apps can be buggy. Invest in premium apps for better data interpretation.
Tip 5: Keep the ECU Updated
Older software can cause compatibility issues. Keep your vehicle and scanner firmware updated.
Final Thoughts
Learning how to read live data from OBD II scanners empowers you as a car owner. Whether you’re troubleshooting the check engine light or optimizing performance, live data gives you a clear window into your car’s health.
Using a reliable scanner, interpreting data with care, and maintaining scanner-to-vehicle compatibility ensures you’re always one step ahead of mechanical problems. Bookmark this guide and explore more OBD2 tutorials and tool reviews on BestOBD2Scanners.com.
Frequently Asked Questions (FAQs)
1. What is the main purpose of reading live data from an OBD2 scanner?
Live data allows you to monitor your vehicle’s health in real-time, making it easier to diagnose performance issues before they become severe or costly.
2. Can I read live data without a professional mechanic?
Yes! With a compatible OBD2 scanner and a good app or software, any car owner can read and interpret live data.
3. Why is my OBD2 scanner not showing any live data?
This could be due to compatibility issues, a poor connection, a cold engine, or outdated firmware in the scanner. Make sure everything is properly connected and warmed up.
4. What is the difference between live data and DTCs?
DTCs are stored trouble codes, while live data represents real-time sensor information that helps confirm or further diagnose the source of those trouble codes.
5. Is it possible to clear codes using live data?
Yes. Most advanced scanners that read live data also allow you to clear trouble codes after you’ve reviewed or repaired the issues.
6. Do all OBD2 scanners offer live data functionality?
No. Some basic models only read and clear codes. Make sure to choose a scanner that specifically mentions live data capabilities.
7. What should fuel trim values look like in live data?
Ideal STFT values range from -10% to +10%, while LTFT values should remain between -5% and +5%. Deviations can signal air/fuel imbalance or sensor issues.
8. Is live data helpful for emissions testing?
Absolutely. Live data helps you verify sensor performance and emission readiness, ensuring your car passes inspections.
9. How often should I scan my vehicle using live data?
Once a month or before long trips is ideal. Always scan if your check engine light comes on.
10. What mobile apps are best for reading live OBD2 data?
Top-rated apps include Torque Pro, OBDeleven, Car Scanner, and OBD Auto Doctor.